SIGNALS / HOW IT WORKS

How it works, on your chart

One fixed model follows four markets. When it takes a trade, the signal appears on your chart with its entry, stop and target, and one TradingView alert carries the messages for all four markets. You decide what to do with it.

Read one signal.

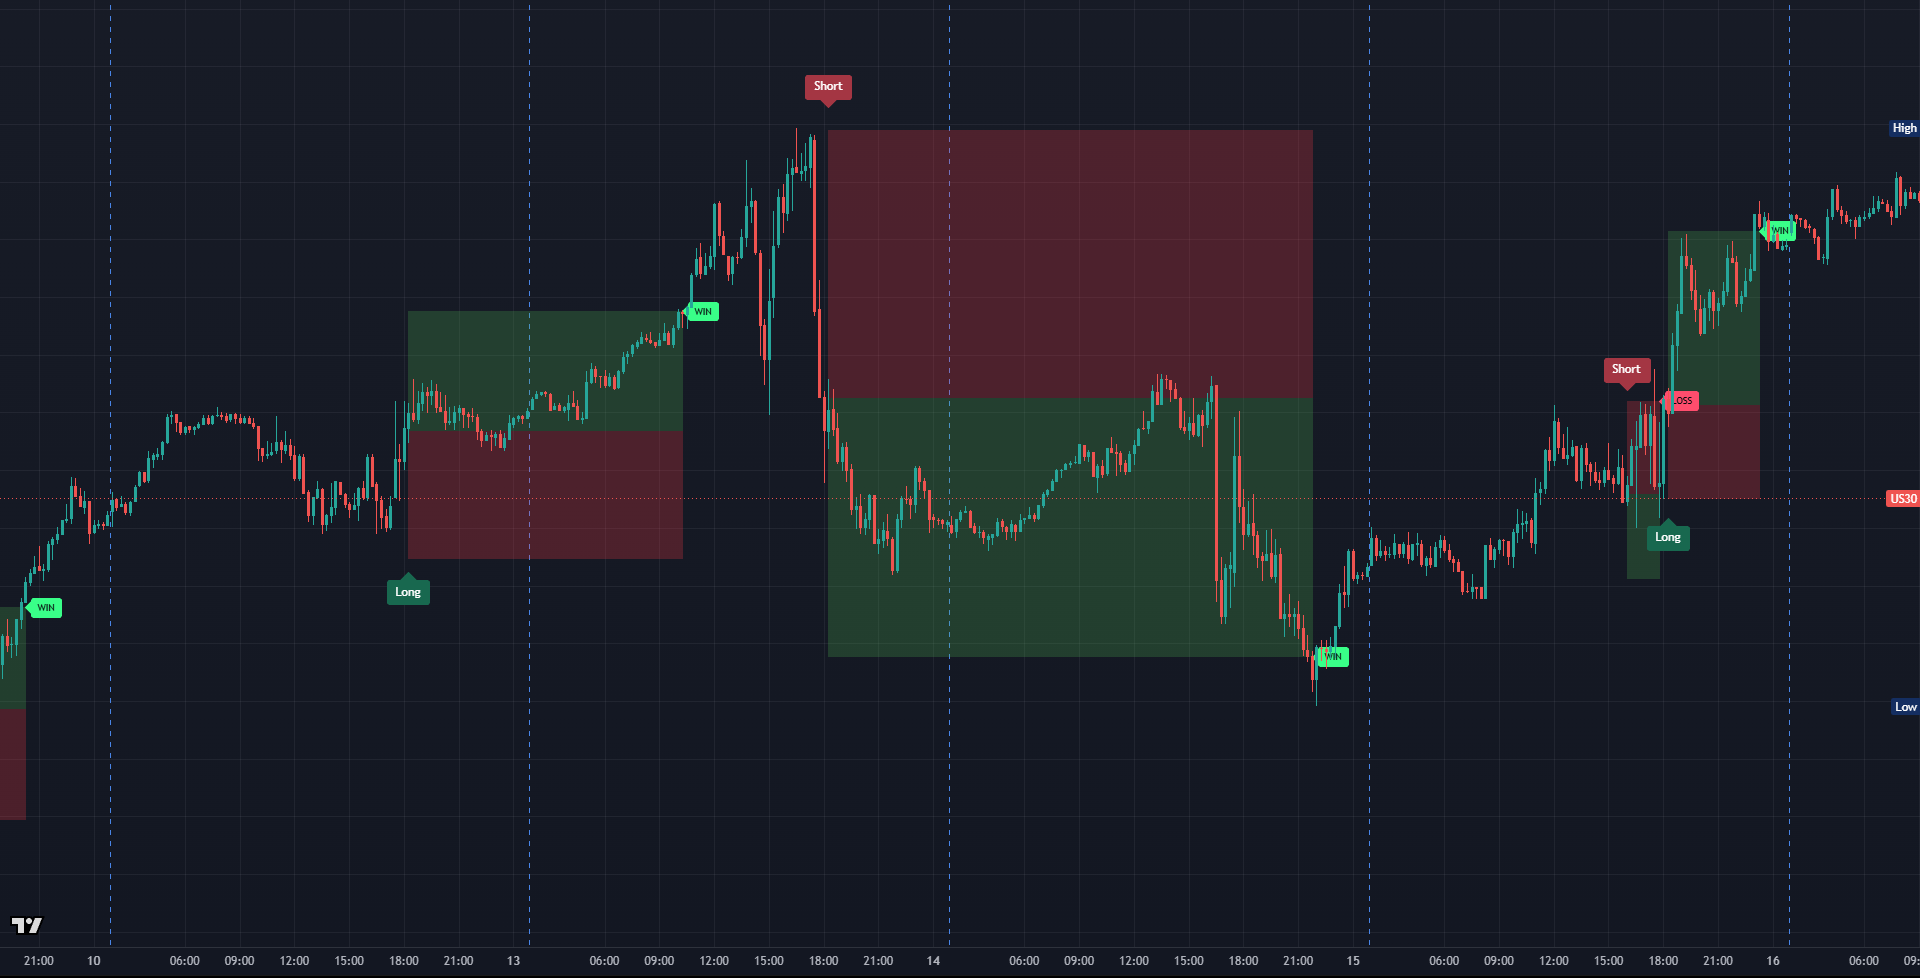
Each signal comes with a direction, an entry, a stop and a target. Step through a buy on the Dow.

01 / Entry

The Long flag marks a buy setup. The entry is recorded at the setup candle’s close.

02 / Stop

The red box marks the stop, so you know your risk before you enter.

03 / Target

The green box marks the target, so you know the exit plan from the start.

04 / Closed-trade tags

WIN marks a closed trade that reached its target.

LOSS marks a closed trade that reached its stop.

On by default. Switch them off in the indicator’s settings if you prefer a clean chart.
DOW / 15mONE SIGNAL, STEP BY STEP
Dow Jones (US30) chart with Long and Short flags, stop and target boxes, and WIN and LOSS tags on closed trades.
Dow Jones (US30) · 15m · 9 Oct 19:00–16 Oct 09:00 2026 (UTC+4)Example week · Optional WIN/LOSS tags on · Chart: TradingView.

Buy and sell.
Four markets.

Open Levels gives buy and sell signals on gold, USDJPY, US30 and US500. Pick a market to see an example week on TradingView.
GOLD / 5mEXAMPLE WEEK
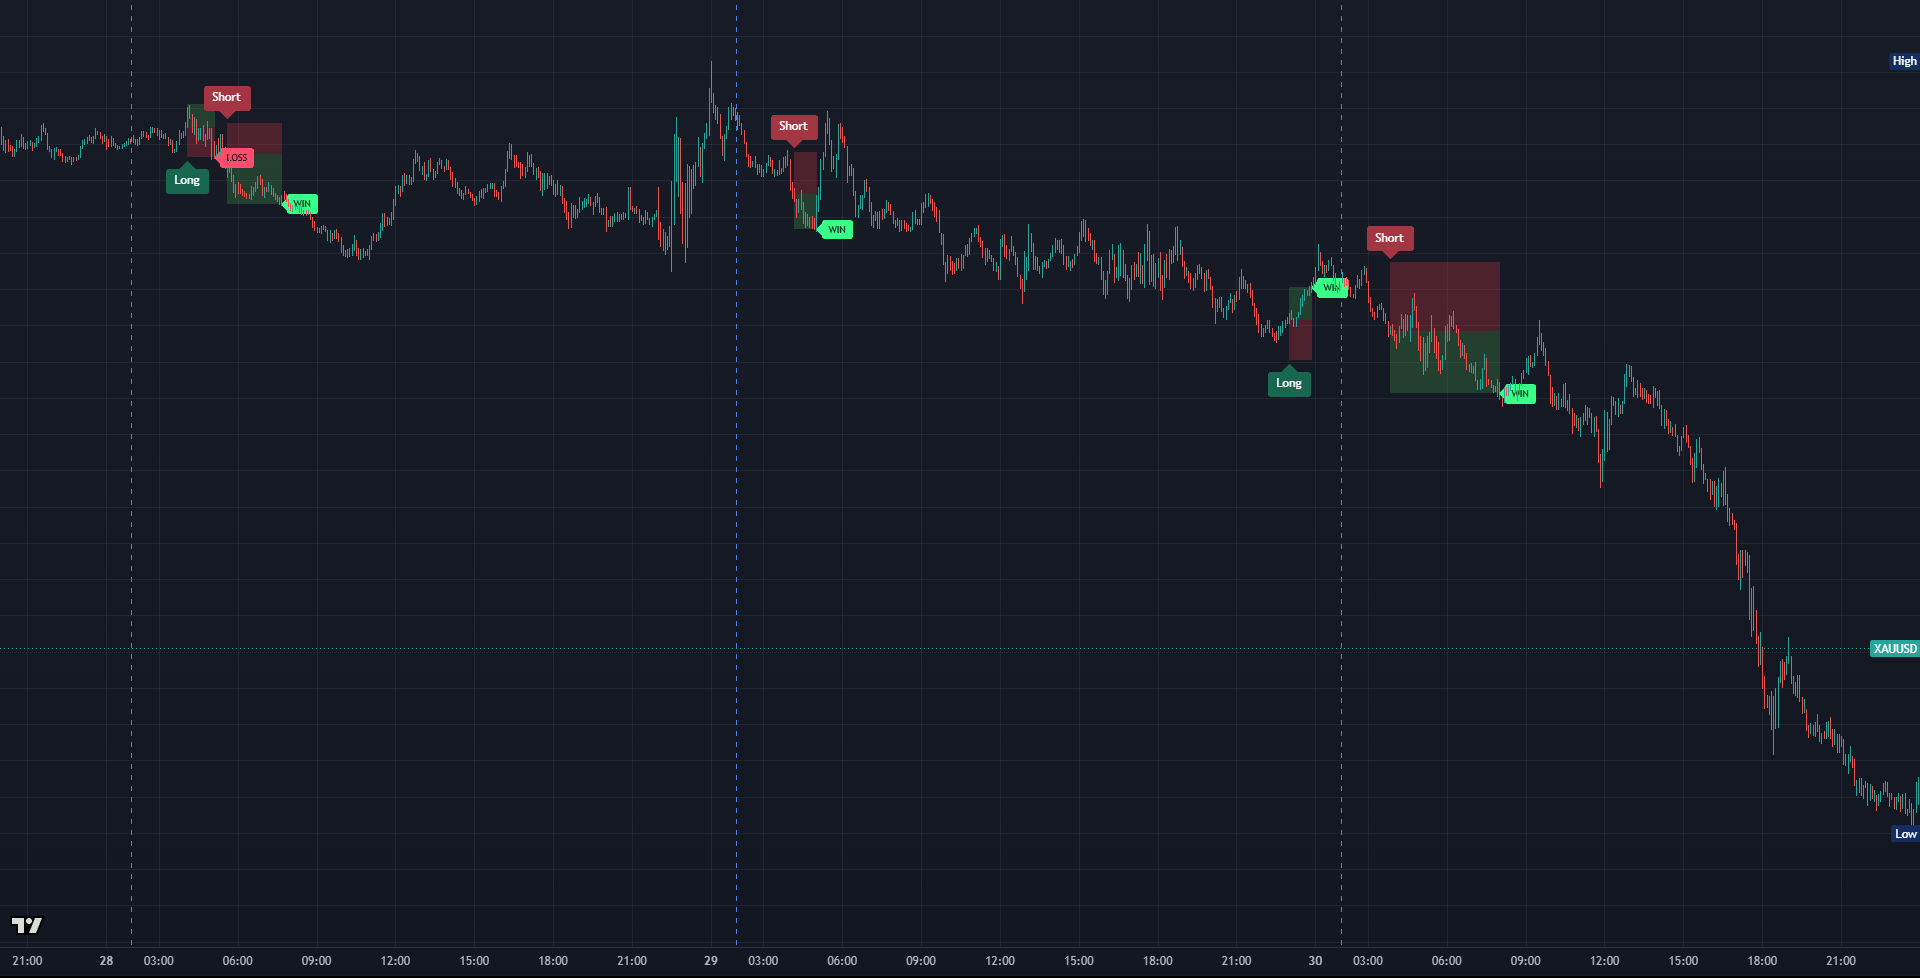
Gold (XAUUSD) chart with Long and Short flags, stop and target boxes, and WIN and LOSS tags on closed trades.
Gold (XAUUSD) · 5m · 27 Oct 20:00–31 Oct 00:00 2026 (UTC+4)Example week · Optional WIN/LOSS tags on · Chart: TradingView.Open the full-size Gold (XAUUSD) chart
USDJPY / 15mEXAMPLE WEEK
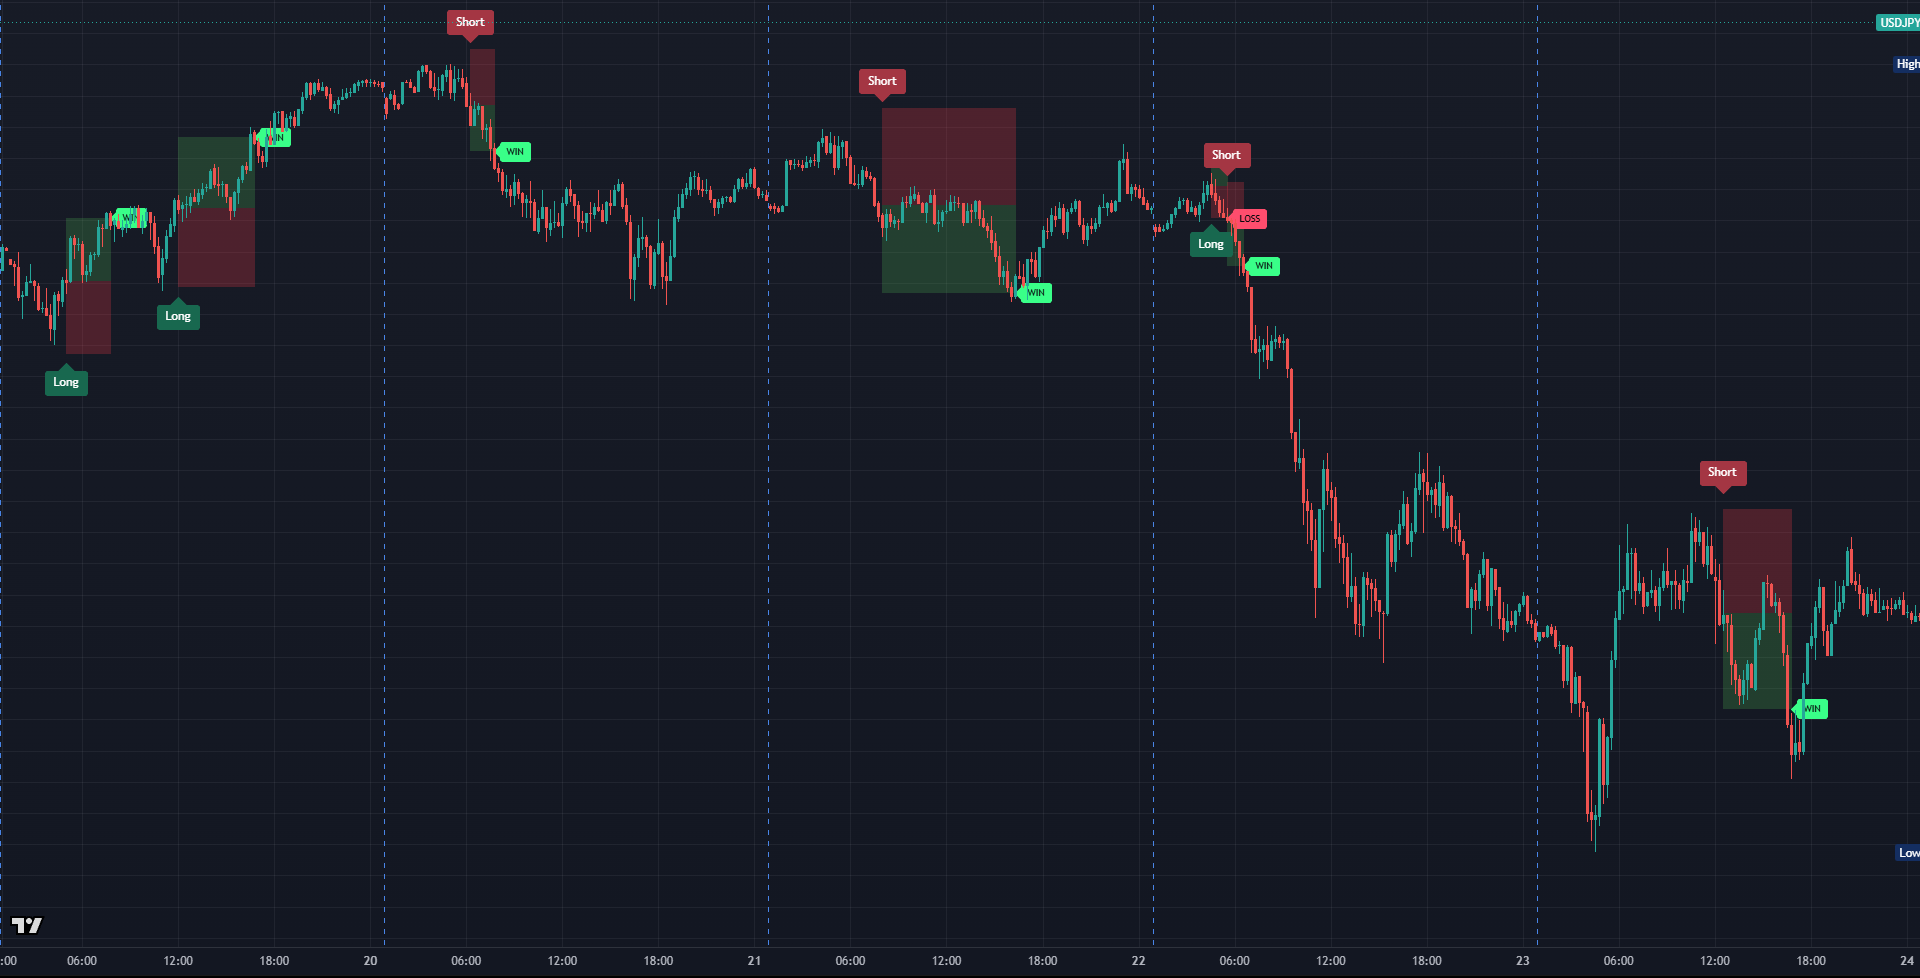
USDJPY chart with Long and Short flags, stop and target boxes, and WIN and LOSS tags on closed trades.
USDJPY · 15m · 17 Oct 03:00–24 Oct 09:00; bars 19–23 Oct 2026 (UTC+4)Example week · Optional WIN/LOSS tags on · Chart: TradingView.Open the full-size USDJPY chart
DOW / 15mEXAMPLE WEEK
Dow Jones (US30) chart with Long and Short flags, stop and target boxes, and WIN and LOSS tags on closed trades.
Dow Jones (US30) · 15m · 9 Oct 19:00–16 Oct 09:00 2026 (UTC+4)Example week · Optional WIN/LOSS tags on · Chart: TradingView.Open the full-size Dow Jones (US30) chart
S&P 500 / 15mEXAMPLE WEEK
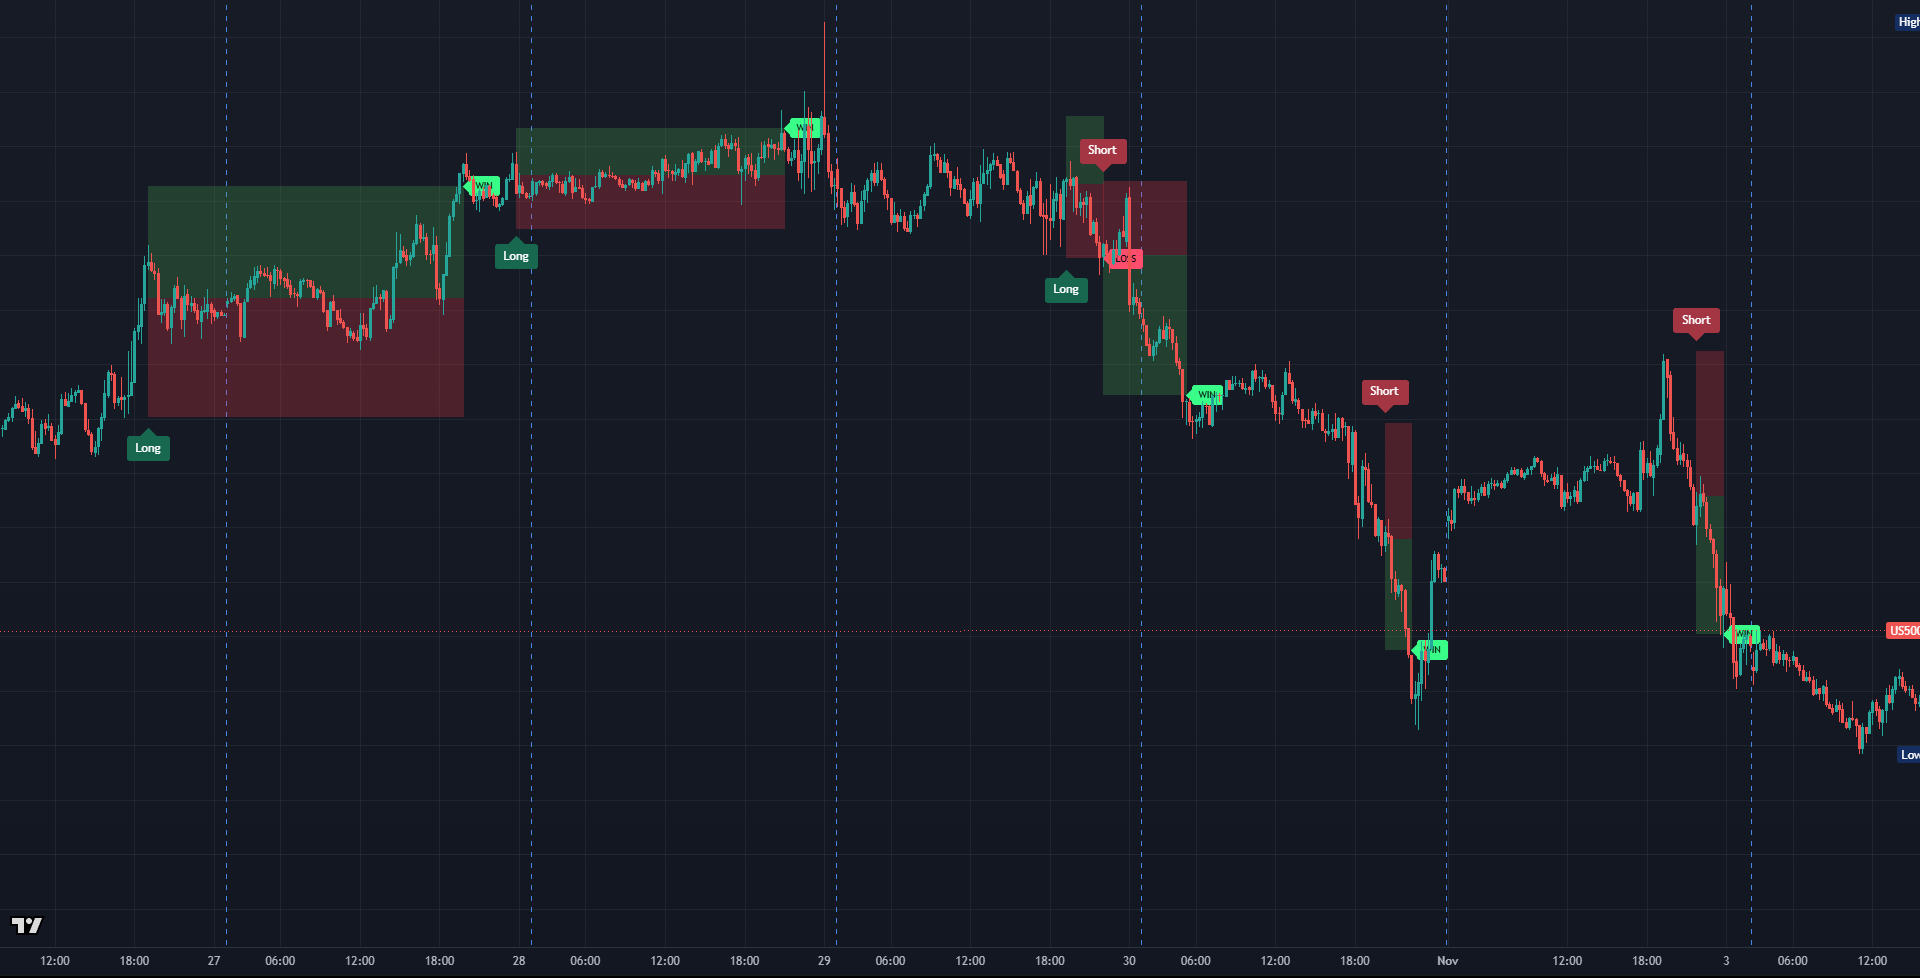
S&P 500 (US500) chart with Long and Short flags, stop and target boxes, and WIN and LOSS tags on closed trades.
S&P 500 (US500) · 15m · 26 Oct 08:00–3 Nov 16:00 2026 (UTC+4)Example week · Optional WIN/LOSS tags on · Chart: TradingView.Open the full-size S&P 500 (US500) chart

One panel.
All four markets.

The panel shows what the model is doing on each market, from scanning to a confirmed signal, with time in trade and a bar from stop to target. Pick a state to see it on the gold row.

Panel (illustration).

Scanning: the model is watching this market for a setup.

From setup to signal

  1. ◎ SCANNING Watching for a setup.
  2. ◌ PREPARING A setup is taking shape.
  3. ◆ READY Formed, awaiting confirmation.
  4. ◆ SIGNAL CONFIRMED The signal is in.
  5. ▲ LONG / ▼ SHORT In a trade.
  6. ■ DONE TODAY Finished for the day.

One alert.
Four markets.

Create one TradingView alert on a 1-minute reference chart and it covers gold, USDJPY, US30 and US500. The drawings and the panel work on any chart and timeframe; only the alert needs that chart.

Example messages (illustration).

Market: which of the four markets the signal is on.

What the alert sends

READY
A setup has formed and is waiting for confirmation. There is no set warning time, and it may never trade.
CONFIRMED
The signal: market, direction, stop and target. A signal can come without a READY first, for example a reversal right after a stop.
NO LONGER READY
Or another closing notice: what became of a READY that did not turn into a confirmed signal.
EXIT
How the reference model’s trade ended, at its stop or its target. It describes the model’s trade, not your orders.

What you need for alerts

  • A TradingView plan that includes alerts.
  • One 1-minute reference chart with Open Levels, and the alert set to “Any alert() function call”.
  • The TradingView app on your phone, with notifications on.

Your chart.
Your orders.

Open Levels never places an order and never connects to your broker. It shows each signal clearly and sends the alert. You decide whether to take the trade, and you place it yourself.

Your chart keeps the last 30 days of signals, with every closed trade tagged WIN or LOSS, so you can see how the model has been trading lately.